Mission Analysis and Planning
CONOPS based analysis, optimisation and planning of your mission against real physics conditions
- Price
- From €6,900
- Clock
- Expected within 10 working days
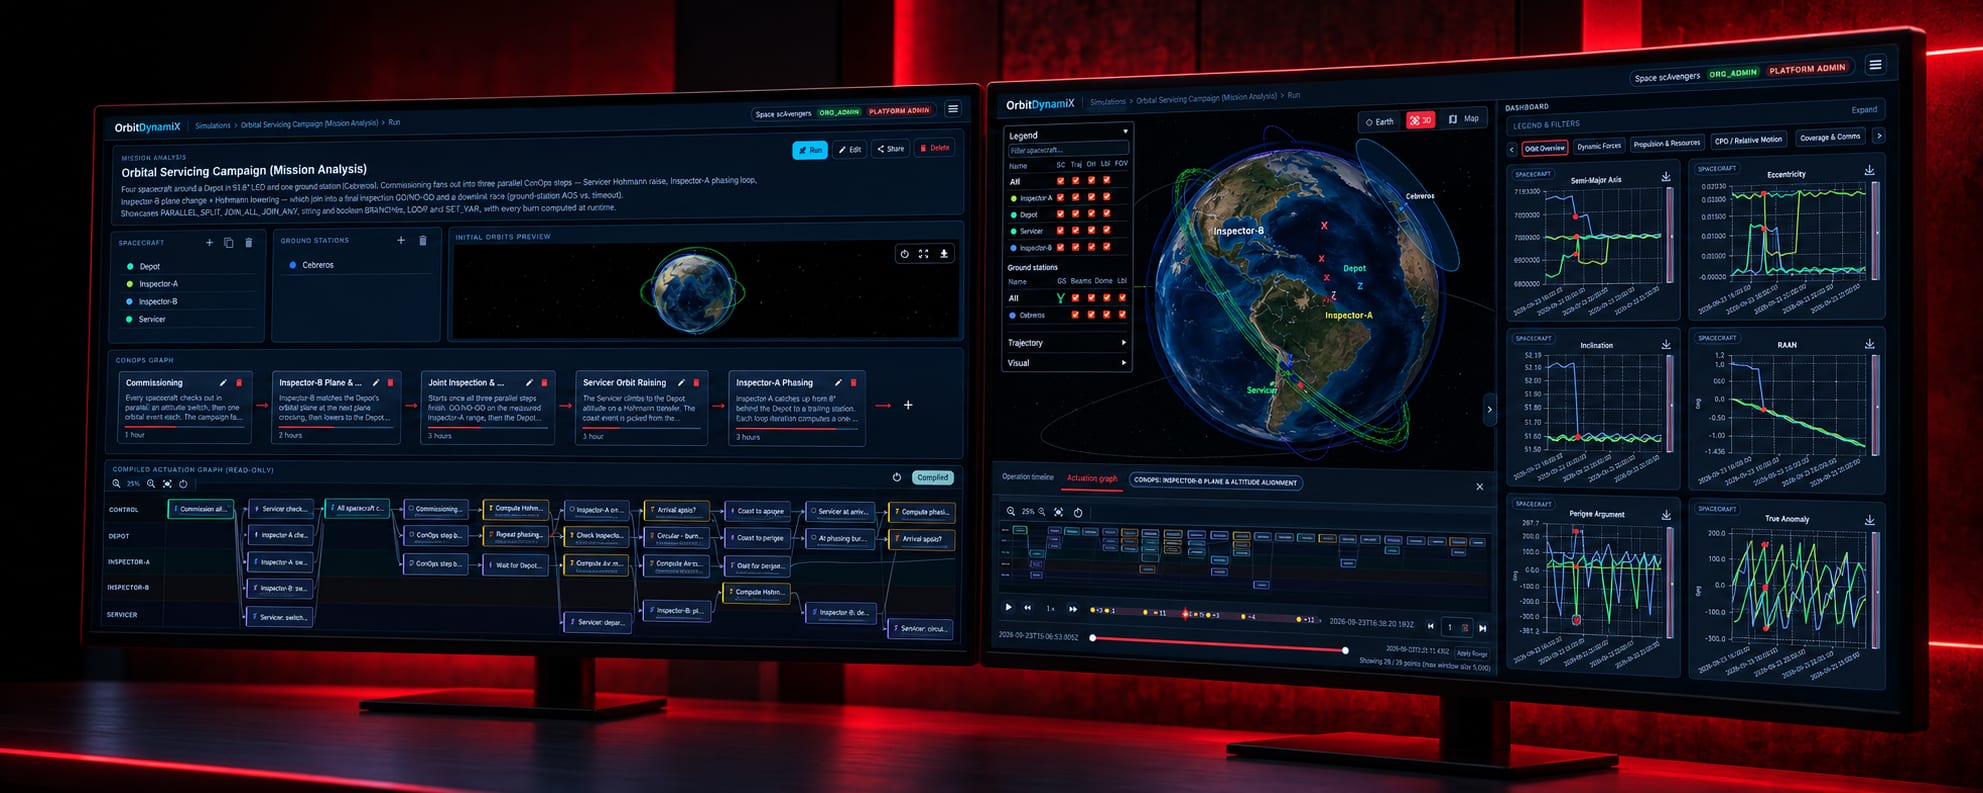
Decision-grade orbital analytics
One or a fleet? Your mission lifecycle in one place
mission analysis and planning · end-of-life analysis for compliance · fleet and spacecraft operations · constellation analysis and optimisation
OFFER
CONOPS based analysis, optimisation and planning of your mission against real physics conditions
re-entry compliance assessment
a continuous overview and assessment for each object you subscribe
Four tiers by fleet size.
More details on FleetWatchfleet size and revisit optimisation to fulfil your needs
Web based. Nothing to install, shareable across your team, reachable from anywhere.
how many satellites, in how many planes, for the cadence your service has to promise
what tilting the camera buys in revisit and costs in ground resolution
what a partly deployed fleet can honestly promise, and when
position against prediction, refined every month
when you can talk to it, for how long, and how much data fits through the window
how long station keeping can be sustained on what remains
when it comes down, against which rule, signed by the engineer who checked it
All seven are computed on our own orbital dynamics engine.
What the three offers actually produce.
A chart with fleet size on the horizontal axis and revisit time on the vertical, both unnumbered because the curve is a shape rather than a measurement. A falling curve shows revisit improving as fleet size grows, with diminishing returns. A dashed red line marks a stated revisit target. A red arrow runs backwards along that target line to the point where it meets the curve, and then straight down to the horizontal axis, marking the fleet that meets it. The diagram is labelled illustrative.
A horizontal strip standing for one month, with a spacecraft on each of two rows. Along each row, contact windows are drawn as narrow outlined boxes of differing widths. They are not evenly spaced: they arrive in clusters of three or four close together, then long stretches of bare line with none at all. Two brackets under the lower row label one cluster and the empty span beside it. The strip carries no dates, no durations, no station names and no axis values, and the figure is labelled illustrative.