C
CONSTELLATION BLUEPRINT
Fleet size and revisit optimisation
the most expensive decisions in a constellation are geometric: how many satellites, in how many planes, and what revisit that buys. This study answers them before you buy a single satellite
GET ANSWER TO QUESTIONS
- How often will one satellite see any given point on Earth?
- How much does tilting the camera off-nadir improve that, and what does it cost in image quality?
- How many satellites, in how many orbital planes, are needed to promise customers a given revisit time?
- What can a half-deployed fleet honestly sell?
- Will each satellite deorbit within the legal limit, or is the disposal plan a licensing problem waiting to happen?
THE ANALYSIS
One table: number of satellites, in different plane arrangements, against the revisit time each fleet achieves, at nadir and at each camera-tilt setting.
It is built to be read backwards. You find the revisit your business has to promise, and read off the smallest fleet that delivers it.
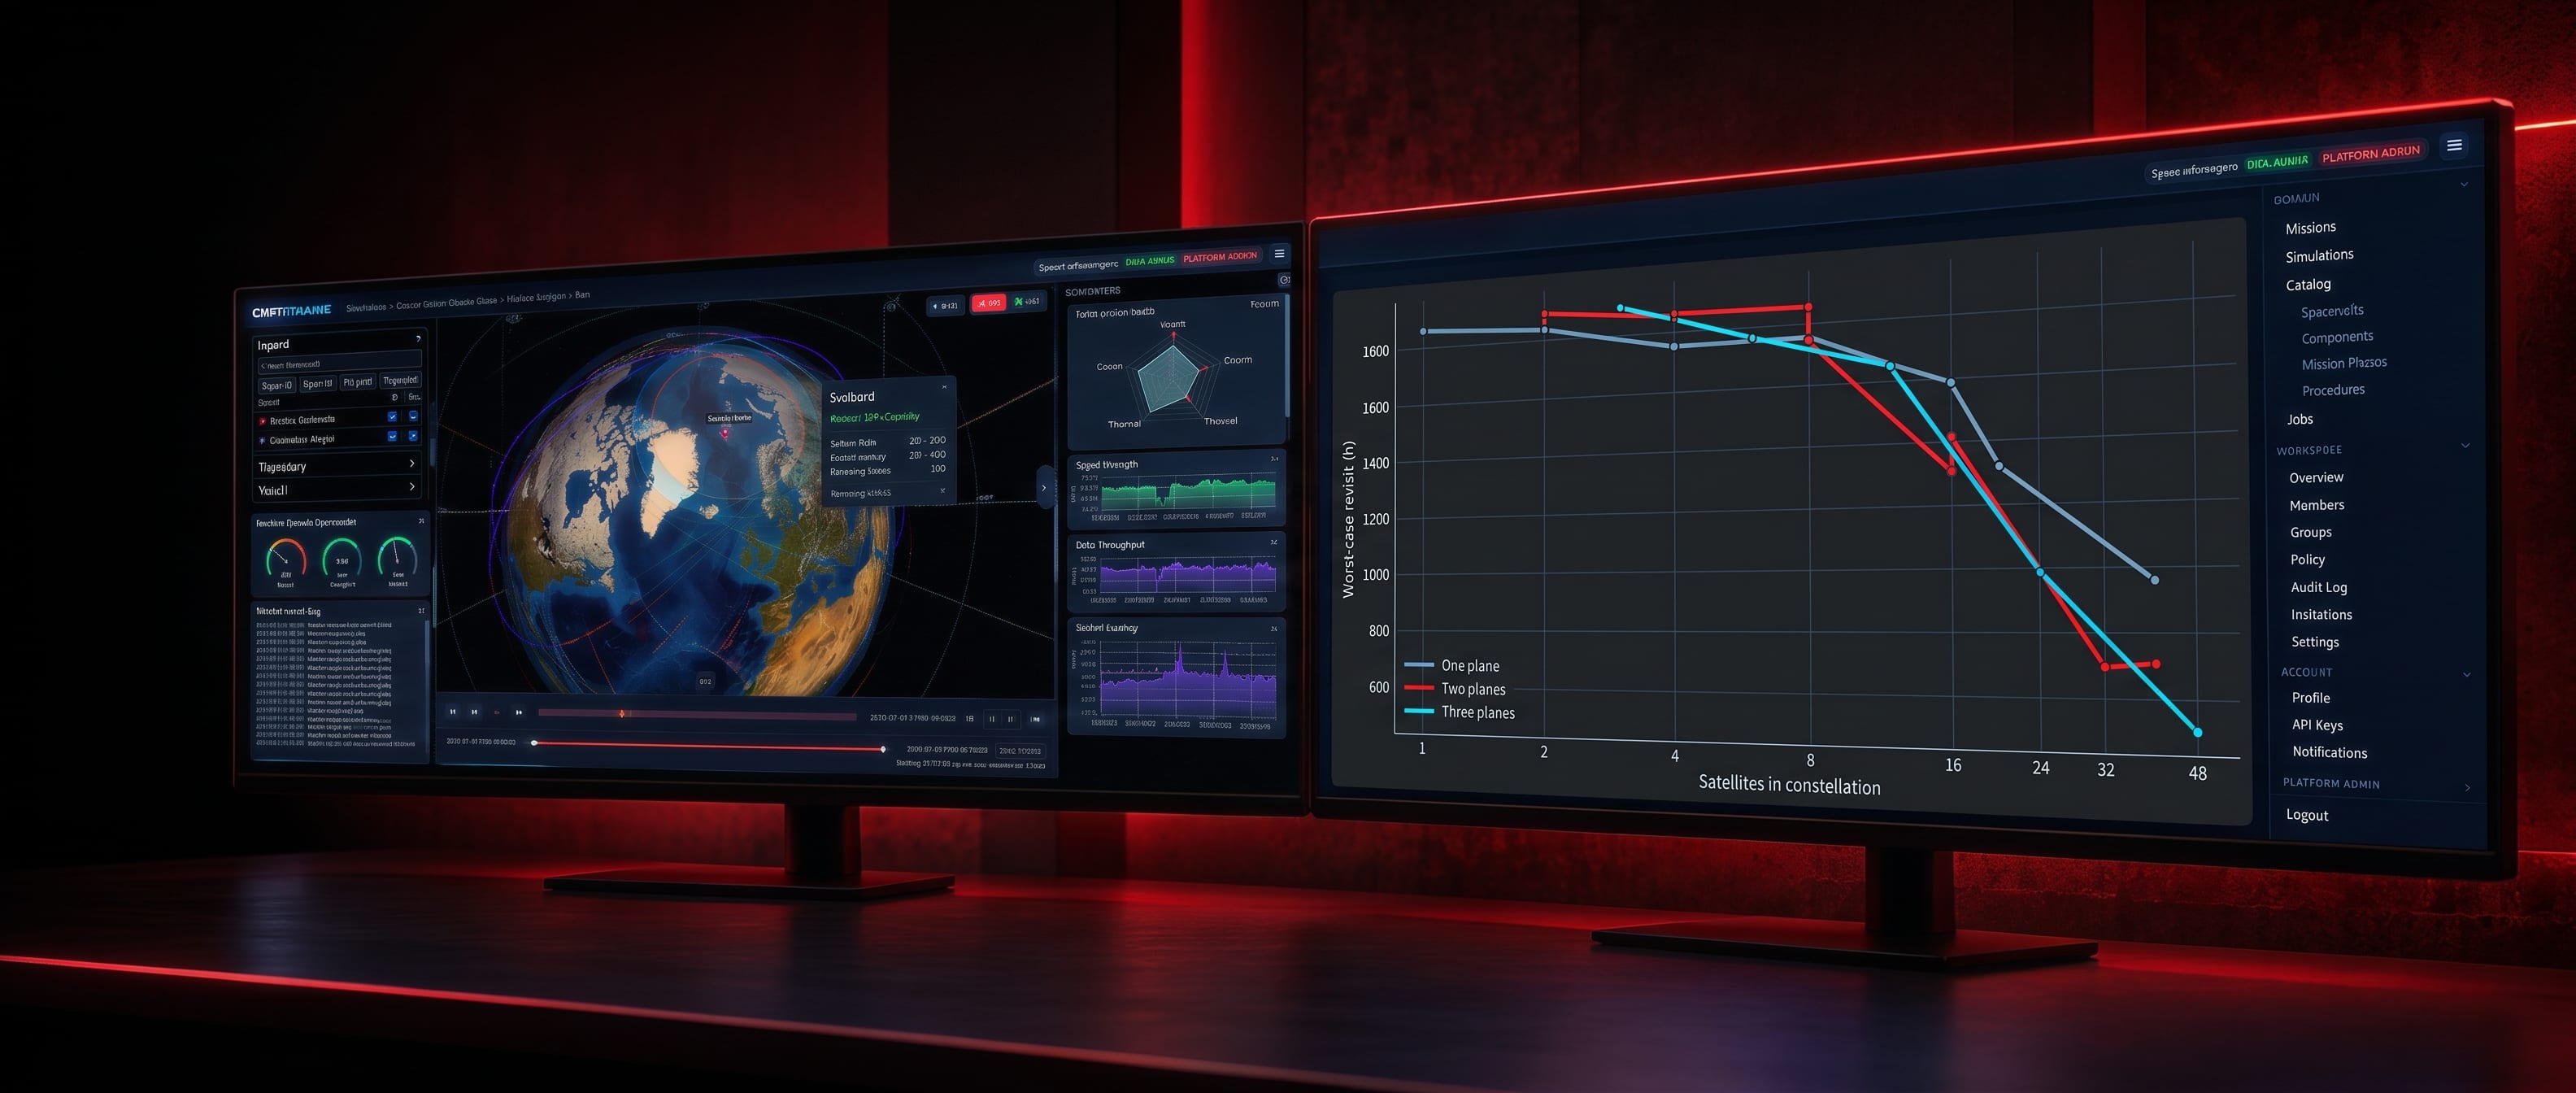
A chart with fleet size on the horizontal axis and revisit time on the vertical, both unnumbered because the curve is a shape rather than a measurement. A falling curve shows revisit improving as fleet size grows, with diminishing returns. A dashed red line marks a stated revisit target. A red arrow runs backwards along that target line to the point where it meets the curve, and then straight down to the horizontal axis, marking the fleet that meets it. The diagram is labelled illustrative.
Start at the revisit you must promise, run across to the curve, then drop to the axis: that is the fleet that meets it. The shape is the argument; the numbers are yours and come from the study.
WHAT ARRIVES
The analysis report
Every analysis requirement answered in its own section, with a traceability matrix giving each one a closure status.
The trade table
Satellites against revisit, looking straight down and at off-nadir angles, single- and multi-plane, in both standard constellation geometries, Walker Delta and Walker Star, built to be read backwards from a revisit target.
Pointing recommendation
An operating angle, the budget assumption behind it stated plainly, and how the recommendation moves if the budget moves.
Disposal and lifetime verdict
Monte Carlo lifetime with a compliance finding against both the five-year rule and the twenty-five-year guideline, and the single decision variable identified.
Coverage build-up
What a partly deployed fleet can credibly promise, and when.
Sensitivity chapter
Altitude, local time, injection accuracy, with the noise floor measured by a control experiment.
Findings briefing
The short deck: the handful of findings that matter, one per slide.
Assumptions register and run provenance
Every limitation stated, every figure traceable to a named run.
THE TIERS
- Full €19,900
- Single-spacecraft mission analysis plus constellation analysis with multi-plane Walker families, variants swept to your own revisit target, Monte Carlo lifetime, full sensitivity, the analysis report and the findings briefing.
- Baseline €14,900
- The single-spacecraft analysis in full, the constellation trade as an outlook rather than a full sweep, the regulatory check at desk level, and no Monte Carlo in the disposal and lifetime verdict.
- Bespoke from €28,000
- Extended variants beyond the standard families: additional patterns, phasing campaigns, combined-parameter sensitivity at depth.
At any stop you keep everything produced and owe nothing further. Baseline upgrades to Full, with the Baseline fee credited.
THE PROGRAMME
A left-to-right flow of five stages. Week 0, before the clock: the purchase order is received and the input checklist issued, and 50% is invoiced on the order. Week 1: kickoff, and the baseline is frozen into a written specification. Then the runs: the coverage pass, the year-long solar pass, constellation families single- and multi-plane in both Walker Delta and Walker Star, a sweep of pointing angles, and Monte Carlo lifetime. Then the draft: the draft report and one consolidated review cycle, and 25% is invoiced on the draft. Then the final: the final report, the findings briefing and the closing meeting, and the remaining 25% is invoiced on the final. The stages are ordered and are not scheduled: no total duration is stated.
Five stages in order, with the three points at which it is invoiced.
Intellectual property
Results and deliverables belong to you on full payment. OrbitDynamiX, its models, methods, software and know-how, remain ours, and no platform licence is implied.
REQUEST ONE
Tell us the revisit your service has to promise. The study is read backwards from it.
Thanks. Your application is in. We reply within two working days.
That did not send. Please try again, or write to info@spacescavengers.sk.